Most baseball fans have a good handle on what type of hitter should in which spot in the batting order. For instance, a speedster should hit leadoff, your big slugger hitting cleanup, etc. Tom Tango, Mitchel Lichtman, and Andy Dolphin in their book “The Book” provided statistical analysis to optimize a batting order. They based their analyses on the number of plate appearances and the frequency of base/out states (e.g. how often the cleanup hitter comes to bat with runners in scoring position).
I won’t go through all the explanation as Tango, Lichtman, and Dolphin did a much better job. If you don’t want to read the original source, Beyond the Box Score did a great job providing an overview and Bluebird Banter went through some of the statistical analysis.
We wanted to see how that analysis would transfer to actual wins and losses. We looked at two scenarios using the greatest leadoff hitter, Rickey Henderson, and the greatest hitter of all-time, Babe Ruth.
As we normally do, we used OOTP16 and created 9 teams filled with average clone position players and pitchers. Then we imported the 1982 version of Rickey Henderson and cloned him to make nine Rickey’s – one for each team. For each team, he hit in a different spot in the batting order (including the ninth spot – there was no DH in this league so the pitcher batted eighth on that team).
Then we simmed almost 2000 games for each team, and (WARNING!!!! MATH TERM!!!) checked the binomial probability of each winning percentage to see if it was significantly different than what you might see flipping a coin 2000 times.
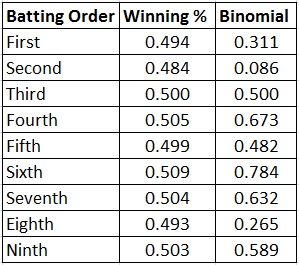
Here are the winning percentages for when Rickey hit in each spot in the lineup and the result of the binomial distribution calculation:
All values were not significantly different from a coin flip (a value of less than .050 would have meant they lost more significantly more games and a value greater than .950 would have meant they won significantly more games).
Surprisingly, the second spot in the batting order was the closest to being significant – but in the opposite way than expected, with the team losing more games than they won when Rickey hit second. The team performed the best when Rickey hit sixth.
So after almost 2000 games (more than 12 full seasons), it didn’t significantly matter where Rickey batted in the lineup. Each team’s win total was no different than what you might expect from flipping a coin 2000 times.
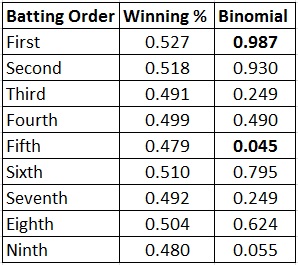
We did the same for Babe Ruth, using the 1921 version of Ruth that won our League of All-Time Greats. With Ruth, we found different results.
Hitting Ruth leadoff resulted in a significantly greater number of wins than expected by chance, due to the number of additional plate appearances by the leadoff hitter (4.66 PA/game as a leadoff hitter compared to 4.46 in the #2 spot, decreasing steadily down to 3.81 in the #9 hole).
Hitting Ruth second approached but did not meet the criteria for significance, while hitting Ruth 9th approached but did not reach significance for fewer wins than by chance. Surprisingly, hitting Ruth 5th did result in significantly fewer wins than expected over the course of almost 2000 games. We have no explanation for this, as Tango’s analysis says the number of plate appearances and the expected baserunner/out situations has the #5 spot as the fourth most important (after #1, 2, and 4).
Ruth’s RBI stats would have likely suffered by hitting him leadoff – in 12+ seasons he had 7% fewer RBIs than the Babe Ruth who hit 3rd and 18% fewer RBIs than the one who hit 4th – but the extra plate appearances would have likely led to marginally more home runs (4% more in our sim), and his relatively high on-base percentage would have had him on more for later hitters to bring in (the leadoff Ruth had 15% more runs).
Most importantly hitting him in the leadoff spot might have meant even more wins for the Yankees.
You can follow us on Twitter @BullpenByComm


