The League of All-Time Greats

Who had the greatest season of all time? Is it one of Babe Ruth’s many dominating seasons? Is it the 2001 version of Barry Bonds when he hit 73HR? Different stats tell slightly different stories. WAR has a different all-time leaderboard than Runs Created, which is also different from WPA (Win Probability Added). While that is a totally separate issue, we wanted to see how well the all-time greatest seasons stacked up head to head with each other, so the League of All-Time Greats came into being, once again using OOTP 15.

This league is made up of only 8 teams, split into 2 divisions. Going by Runs Created, which seems to be pretty robust metric in OOTP, we took the top 8 RC for a single season with the caveat that each player can only appear once – or else we would have more than half the league being made up of different versions of Babe Ruth and Barry Bonds. Each team’s lineup is made solely of that player without changing any of their season attributes, meaning that most players will be playing out of position.

The teams (Runs Created in parentheses):
– 2001 Barry Bonds (230)
– 1921 Babe Ruth (229)
– 1927 Lou Gehrig (208)
– 1932 Jimmie Foxx (202)
– 1922 Rogers Hornsby (202)
– 1930 Chuck Klein (193)
– 1998 Mark McGwire (193)
– 2001 Sammy Sosa (193)

The teams were divided into two divisions: The “Old-Timers” league was anyone from 1930 and before, while the “New-Timers” league consisted of the rest. The winners of each division meet in a best-of-nine World Series.

As we needed to set a year for this league to occur, we chose a year in between the two gaps (pre-1932 and post-1998) that had obvious baseball significance: 1961.

We also needed to fill out their teams with pitchers. We decided upon one pitcher for all, and again wanted to find someone meaningful. We didn’t want a superstar pitcher but landed someone above average with historical significance. We chose Orvall Overall, who played for the Cubs and lays claim to being the first pitcher to strike out 4 batters in one inning of a postseason game (not duplicated until Anibal Sanchez in 2013). More importantly he was the last man to be on the mound for the last out in a World Series clinching game for the Cubs.

The teams were all set up ready for Opening Day. The experts had their preseason predictions, and it looked like it was unsurprisingly going to be a Babe/Barry free for all.
Preseason Predictions

And the schedule makers wanted to start the season off with a bang.
Opening Day

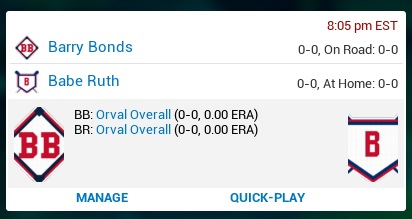
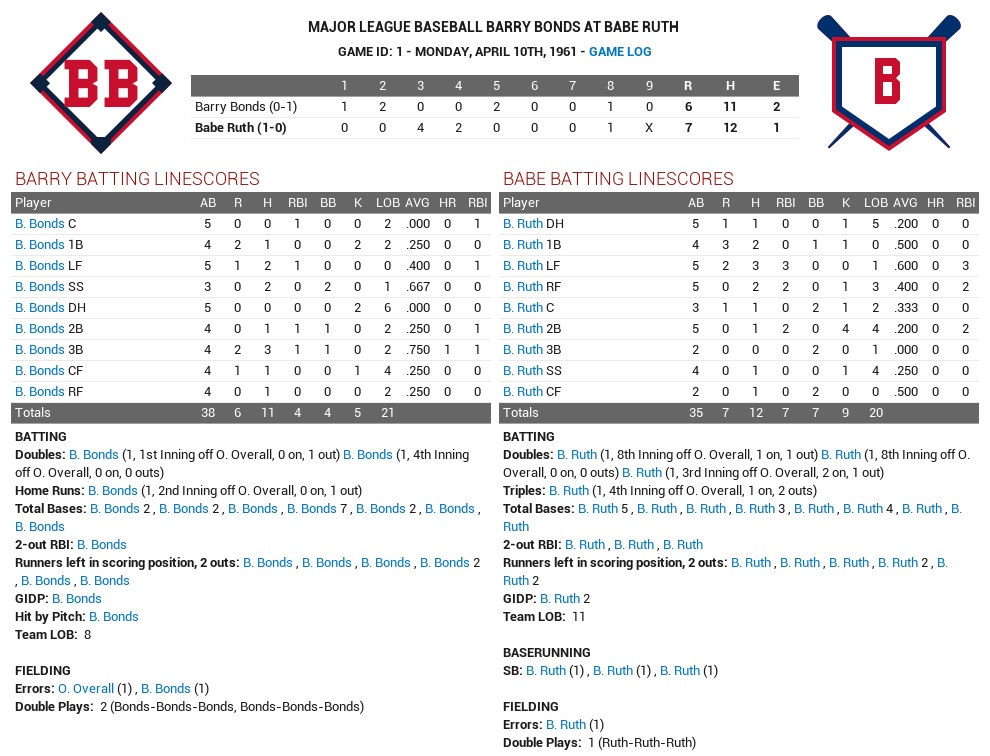
In the Opening Day matchup, Bonds hit the only home run, but 3 separate Babe Ruth’s stole bases. Two Ruth doubles in the bottom of the 8th were the difference as Babe Ruth took the game 7-6.
Opening Day Game

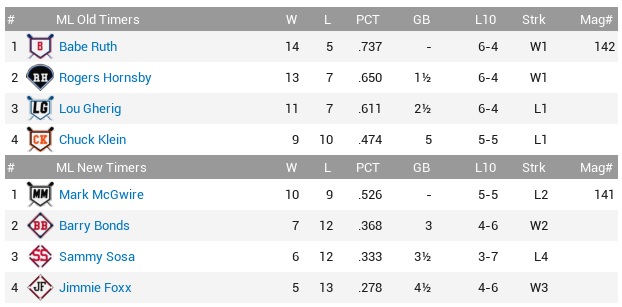
That Opening Day loss stung Barry, and Bonds went on to lost the next two games to Ruth before finally getting a victory in the fourth and final game of the series. After winning two more in a row against Jimmie Foxx, Bonds went into a funk (maybe steroids weren’t as readily available in 1961?) and would lose 7 in a row, including getting swept by Rogers Hornsby. Bonds would show some signs of life at the end of April, beating Mark McGwire 8-0 and 17-7 in two consecutive games.

Babe Ruth meanwhile won 10 of his first 11 games, sweeping Chuck Klein and Sammy Sosa. He finished April 14-5 with a 1.5 game lead of Rogers Hornsby.

Jimmie Foxx got off to the slowest start, losing 12 of his first 13 being swept by Chuck Klein, Lou Gehrig, and Rogers Hornsby before finishing the month on a high note sweeping Sammy Sosa.
April

Will Barry turn it around? Thankfully for him Sosa and Foxx also stumbled out of the gate. More to come…

2015 NL Team Free Agent WAR Analysis

Pitchers and catchers have reported.  People need reasons to look toward spring especially if you live in the Eastern half of the country.  So, let’s evaluate some ballplayers!

In this post, I will be evaluating the offseason free agent acquisitions for the National League.  I will be using WAR (Wins Above Replacement) to evaluate the fifteen NL teams and its players.  (WAR stats are courtesy of www.fangraphs.com – if you click on the player’s name, it should direct you to their website.)

Braves

Name Position 2014 Team Age 2014 WAR 2015 WAR CS Years CS Salary New Team Date Years Salary
Nick Markakis RF Orioles 31 2.5 0.9 3 $33.00 Braves 12/3/2014 4 $44.00
Jason Grilli RP Angels 38 0.3 0.6 Braves 12/23/2014 2 $8.30
Josh Outman RP Yankees 30 0 0 Braves 1/7/2015 1 $0.90
Jim Johnson RP Tigers 31 0 0.2 Braves 12/3/2014 1 $1.60
Jonny Gomes LF Athletics 34 -0.3 -0.3 Braves 1/22/2015 1 $4.00
A.J. Pierzynski C Cardinals 38 -0.4 0.7 Braves 12/27/2014 1 $2.00
Alberto Callaspo 2B/DH Athletics 31 -1.1 0.6 Braves 12/9/2014 1 $3.00

Nick Markakis seems to generate the same WAR every year.  His projected WAR this year is a quite a bit lower (a 64% decrease) probably because he’s coming over to the NL where there’s better pitching and his home park is historically a pitcher’s park.  He’s past peak age and he has Freddie Freeman’s company as the only other true power threat in the Braves lineup.  Should be an interesting year for Mr. Markakis.

Jonny Gomes has a cool name.  That’s about all I can say about him.

AJ Pierzynski is now 38 years old.  When the heck did that happen?  He goes from the Cardinals to the Braves.  Fangraphs predicts him to be above replacement level with a projection of 0.7.  Pierzynski’s best days seem to be behind him, but you could do worse at the catcher’s spot.

Brewers

Name Position 2014 Team Age 2014 WAR 2015 WAR CS Years CS Salary QO New Team Date Years Salary
Neal Cotts RP Rangers 34 0.8 0.5 Brewers 1/30/2015 1 $3.00

Neal Cotts is still playing?!?  His K/9 last year was 8.51.  Not bad, but not dominant for a reliever.  He’s a lefty so he’ll probably play for about 8 more years.

Cardinals

Name Position 2014 Team Age 2014 WAR 2015 WAR CS Years CS Salary New Team Date Years Salary
Mark Reynolds 1B/3B Brewers 31 1.6 0.3 1 $4.00 Cardinals 12/11/2014 1 $2.00
Carlos Villanueva RP Cubs 31 1.1 0.3 Cardinals 2/4/2015 1 $0.20
Matt Belisle RP Rockies 34 0.5 0 Cardinals 12/2/2014 1 $3.50

The Cardinals have picked up the MLB single season strikeout leader in Mark Reynolds.  But, he did hit 22 HR last year.  His fellow power lineup mates are Matt Holliday and Jhonny Peralta.  He may have a decent year power-wise.

I keep waiting for Carlos Villanueva to do something exciting like: throw a no-hitter, be an ace starter, or a become a closer.  His career averages:  K/9 – 7.77, BB/9 – 3.0, HR/9 – 1.21.  Ah, that’s the problem… gives up too many long balls.  STL’s home park will not help with that.

Belisle is your average joe middle reliever.  His career HR/9 is below 1.0.  Not bad!

Cubs

Name Position 2014 Team Age 2014 WAR 2015 WAR CS Years CS Salary New Team Date Years Salary
Jon Lester SP Athletics 31 6.1 3.8 6 $132.00 Cubs 12/9/2014 6 $155.00
Jason Hammel SP Athletics 32 1.7 2.3 3 $27.00 Cubs 12/8/2014 2 $20.00
Chris Denorfia RF/LF Mariners 34 0.4 0.9 Cubs 1/6/2015 1 $2.60
David Ross C Red Sox 37 0.2 0.9 Cubs 12/23/2014 2 $5.00
Jason Motte RP Cardinals 32 0 0 Cubs 12/15/2014 1 $4.50

Jon Lester is an above average pitcher, but wow, that’s a lot of moolah.  Well, good for him.  He’s a left-hander.  He’s in his prime.  And he’s pitching half his games at Wrigley Field.  He should have a solid year.   But maybe not as good as last year according to projected WAR.

Hammel had a great year last year.  His WAR was 1.7 .  FanGraphs predicts 2.3.  I predict a worse year.  He’s prone to the long ball and his career HR/9 is over 1.0

Looks like the Cubs picked up a couple of veterans to fill out the roster in Denorfia and Ross.

Jason Motte did not pitch in 2013.  He pitched some last year, but he’s still trying to shake the rust off.  We’ll see if he can help out the Cubs in ’15.

Diamondbacks

Name Position 2014 Team Age 2014 WAR 2015 WAR CS Years CS Salary New Team Date Years Salary
Gerald Laird C Braves 35 -0.1 0.7 Diamondbacks 2/2/2015 1 $0.20

Gerald Laird is your prototypical backup catcher.  Good D, no bat.

Dodgers

Name Position 2014 Team Age 2014 WAR 2015 WAR CS Years CS Salary New Team Date Years Salary
Brandon McCarthy SP Yankees 31 3 2.6 3 $36.00 Dodgers 12/16/2014 4 $48.00
Brett Anderson SP Rockies 27 1.1 2.1 1 $7.00 Dodgers 12/31/2014 1 $10.00
Erik Bedard RP Rays 35 0.2 -0.6 Dodgers 1/18/2015 1 $0.20
Sergio Santos RP Blue Jays 31 0 0.4 Dodgers 12/30/2014 1 $0.20
Dustin McGowan RP Blue Jays 32 0 -0.1 Dodgers 2/23/2015 1 $0.50
Brandon Beachy SP 28 0.7 Dodgers 2/21/2015 1 $2.80

Slight dip in Projected WAR for Brandon McCarthy.  His best WAR year was 4.5 with Oakland.  He is the magical prime age of 31 which is half of the success formula for pitchers coming to the NL.  Too bad he’s not a lefty.

Brett Anderson, another former A, is a lefty, but he’s only 27.  His WAR totals are rather erratic : 2009 – 3.6; 2010 – 2.4; 2011- 1.0 2012 – 0.9; 2013 – 0.3; 2014- 1.1 .  Maybe he’ll get things going in the right direction for Dodger Blue.  Moving from Colorado to LA should help.

Remember when Sergio Santos was a shortstop prospect? No?  I do.

Dustin McGowan reminds me of Carlos Villanueva.  Scouts rave about his arm and talent.  Well, when’s he going to something with it?  Last great year was 2007 – WAR – 3.5.  Move to the NL might bump him up some, but it’s gotta be close to his last chance.

Giants

Name Position 2014 Team Age 2014 WAR 2015 WAR CS Years CS Salary New Team Date Years Salary
Nori Aoki RF Royals 33 2.3 1.6 2 $14.00 Giants 1/16/2015 1 $4.00
Jake Peavy SP Giants 33 1.9 1.2 2 $24.00 Giants 12/19/2014 2 $24.00
Ryan Vogelsong SP Giants 37 1 0.6 1 $7.00 Giants 1/23/2015 1 $4.00
Sergio Romo RP Giants 31 0 0.3 2 $12.00 Giants 12/22/2014 2 $15.00

Nori Aoki is the poor man’s Ichiro Suzuki.   Guy knows how to rake.  He can steal a bit- probably needs to be given the green light more.  WAR is projected to go down, but not much.  His WARs are 2012 – 2.3; 2013- 1.6; 2014 – 2.3; Projected 2015 – 1.6.  Consistent.

Jake Peavy should be a 100 years old by now.  Just kidding.  Just seems like he’s been around forever.  His K/9s are slowly trending downward, but not a bad option for a #3 starter.

Sergio Romo is the Giants closer.  He saved 38 games in 2013 and dipped down to 23 last year.  His HR/9 last year was 1.40.  He will have to correct that if he wants to remain closer.

Marlins

Name Position 2014 Team Age 2014 WAR 2015 WAR CS Years CS Salary New Team Date Years Salary
Michael Morse 1B/LF Giants 32 1 0.8 1 $7.00 Marlins 12/17/2014 2 $16.00
Ichiro Suzuki RF Yankees 41 0.4 -0.7 1 $5.00 Marlins 1/23/2015 1 $2.00
Reid Brignac 3B Phillies 29 -0.3 -1.1 Marlins 11/19/2014 1 $0.20

I always think that Michael Morse is overrated.  He hit 31 HR in 2011, so he has power.  He’s an OK power hitter and his 2015 Projected WAR agrees:  0.8

ICHIRO!  The MLB single season hit leader will be taking his farewell tour to Miami.  ICHIRO struck out 3 times as often as he walked last year, which seems very un-ICHIRO-like.  He stole 15 bases last year probably mostly on brains and guile alone.  But, he is 41.

Reid Brignac.  Likely trying to win a bench spot with the Marlins this year.

Mets

Name Position 2014 Team Age 2014 WAR 2015 WAR CS Years CS Salary New Team Date Years Salary
Michael Cuddyer 1B/RF Rockies 35 1.5 0.7 2 $18.00 Mets 11/10/2014 2 $21.00
John Mayberry 1B/LF Blue Jays 31 0.2 -0.2 Mets 12/15/2015 1 $1.50

Michael Cuddyer signed with the Mets.  Did the Mets move those fences in yet?  Cuddyer is a nice hitter at his age, but his home park will not help him.

Nationals

Name Position 2014 Team Age 2014 WAR 2015 WAR CS Years CS Salary New Team Date Years Salary
Max Scherzer SP Tigers 30 5.6 4.1 7 $168.00 Nationals 1/21/2014 7 $210.00
Casey Janssen RP Blue Jays 33 0.1 0.2 Nationals 2/2/2015 1 $5.00
Heath Bell RP Rays 37 0 -0.2 Nationals 12/27/2014 1 $1.00
Dan Uggla 2B Giants 34 -0.8 -0.3 Nationals 12/26/2014 1 $0.20

The Nats made a big splash in the offseason signing Max Scherzer to a 7 year, $210 million contract adding him to an already loaded pitching staff.  This guy is a dynamite pitcher already and now he’s coming to the NL.  Projected WAR says 4.1, but I say sky’s the limit, folks.

Casey Janssen’s Projected WAR for 2015 went up by 50 percent from his actual WAR in 2014.  It’s that NL effect, I tell ya.  Will compete for the closing job in Washington.

Dan Uggla has an eye condition, according to RotoWire News, which may put his 2015 in jeopardy.

Heath Bell is trying to turn his career around.  His K/9 as recently as 2013 was 9.87.

Padres

Name Position 2014 Team Age 2014 WAR 2015 WAR CS Years CS Salary New Team Date Years Salary
James Shields SP Royals 33 3.7 2.7 5 $90.00 Padres 2/12/2015 4 $75.00
Brandon Morrow RP Blue Jays 30 0.4 -0.2 1 $6.00 Padres 12/16/2014 1 $2.50
Clint Barmes 2B/SS Pirates 35 0.3 0 Padres 12/3/2014 1 $1.50
Josh Johnson SP 31 2.1 1 $5.00 Padres 1/7/2015 1 $1.00

James Shields has pitched 200+ innings 8 seasons in a row.  He’s a good pitcher.  How much more can the arm take?  Stay tuned.

Brandon Morrow’s BB/9 for his career is 4.16.  Pass.

Clint Barmes seems to be coming towards the end of his career.  He’s a decent fielder so he’ll be probably be brought in for defensive purposes.

Josh Johnson has had 2 Tommy John surgeries.  The odds of coming back from this are long.  Hopefully, luck is on his side.

Phillies

Name Position 2014 Team Age 2014 WAR 2015 WAR CS Years CS Salary New Team Date Years Salary
Aaron Harang SP Braves 36 2.5 0 1 $6.00 Phillies 1/5/2015 1 $5.00
Chad Billingsley SP 30 1.1 1 $5.00 Phillies 1/29/2015 1 $1.50

 Aaron Harang is a serviceable starting pitcher.  He’s going to Philadelphia which could make things tough considering their recent history.  His projected WAR this year is 0.0.  On the plus side, Philly’s home park is a pitcher’s park, which could bail him out of HR trouble.

Billingsley’s had surgeries in two straight years: TJ and torn flexor repair.  His career total WAR is 17.2.  Best season was 2008 9.01 K/9; 4.1 WAR.

Pirates

Name Position 2014 Team Age 2014 WAR 2015 WAR CS Years CS Salary New Team Date Years Salary
Francisco Liriano SP Pirates 31 1.6 2.9 3 $36.00 Pirates 12/12/2014 3 $39.00
A.J. Burnett SP Phillies 38 1 1.9 1 $10.00 Pirates 11/14/2014 1 $8.50
Corey Hart DH Mariners 32 -1.2 0.7 Pirates 12/19/2014 1 $2.50

Fangraphs is predicting quite the bump up in WAR for Francisco Liriano 1.6 to 2.9.  He’s a lefty and he’s 31.  Could be a big year!

Burnett is back with the Pirates after a lost year with the Phillies.  PNC is surprisingly more of  a hitter’s park than Citizen’s Bank so Burnett’s HR total might increase.  Keep an eye on it.

Hart is quite injury prone lately with knee and hamstring problems.  He will be platooning with Pedro Alavarez at first base.  But, he’s got some punch in that bat.  Might be a sneaky good pickup for the Bucs.

Reds

Name Position 2014 Team Age 2014 WAR 2015 WAR CS Years CS Salary New Team Date Years Salary
Burke Badenhop RP Red Sox 32 1 0.2 Reds 2/7/2015 1 $2.50
Kevin Gregg RP Marlins 36 0 -0.1 Reds 2/7/2015 1 $0.20
Paul Maholm RP Dodgers 32 0 0 Reds 2/3/2015 1 $0.20

Kevin Gregg.  Hmm.  He threw a cutter 21.5% of the time last year.  Might help him in his new home digs in Cincy.Burke Badenhop before been better?  A bad attempt at an alliterative sentence.  What I mean to say is… has Badenhop ever been good?  Last year was his best WAR year at 1.0.  Half his home games in Fenway Park!  Wow.

Paul Maholm.  He’s a lefty.  He’s 32.  About the best I can say about him is his GB% last year was 54.4%.

Rockies

Name Position 2014 Team Age 2014 WAR 2015 WAR CS Years CS Salary New Team Date Years Salary
Nick Hundley C Orioles 31 0.3 1.5 Rockies 12/31/2014 2 $6.30
Daniel Descalso 2B/SS Cardinals 28 0 0.1 Rockies 12/16/2014 2 $3.60
John Axford RP Pirates 31 0 0.5 Rockies 2/2/2015 1 $0.20
Rafael Betancourt RP 39 0 Rockies 1/30/2015 1 $0.20

Nick Hundley has some pop in his bat.  He’s coming to Coors Field.  Could be a match in baseball heaven!

Descalso comes to the Rockies from St. Louis baseball heaven.  He has zero pop in his bat.  Will get on base occasionally, but won’t thrill you.  Best WAR year 2010 – 0.4.

Axford had a couple of high save total years with the Brewers in 2010 (46) and 2011 (35).  He had two WAR years of 1.8.  Seems to have fallen off a cliff somewhat.  Could bounce back in Colorado, but he’s gotta keep the ball in the park.

Betancourt has had some crazy command years.  89 Ks to 8 BBs in 2010 for the Rockies for a K/BB ratio of 11.25.  He’s fallen off in recent years.  He signed a minor league deal and hopes to hang for a last year of glory in the Mile High City.

Next Up:  The American League!

Recreating Billy Wagner

In honor of Billy Wagner following us on Twitter (@BullpenByComm), and since he was always a favorite fantasy closer (with the exception of the 2000 season), we thought we’d see what might have transpired with his career if things had happened just a little differently.

We started an OOTP historical league in 1995 – the year Billy made his debut with the Houston Astros.

In our alternate universe, Billy started at AA Jackson but quickly made the jump to Tucson in the PCL. Even though he struggled with control, giving up 7 walks in 12 innings, the Astros pulled the trigger and called him up on June 1st, 1995 as lefty reliever Pedro A. Martinez was ineffective. Wagner made his major league debut on June 3rd against the Atlanta Braves – and suffered the loss giving up a run in the 7th on a fielder’s choice after David Justice led off with a double and went to third on a sac bunt. But he was in the big leagues to stay.

His first save came on July 18th, filling in for a tired Todd Jones who had pitched in 4 of the past 5 games. He got the last two outs against the Dodgers on 4 pitches. However, his rookie season came to an abrupt end on August 20th when he left a win against the Reds with discomfort. He was diagnosed with a partially torn labrum, though doctors assured him he’d be ready for spring training. He finished his rookie season going 0-1 with 1 save and a 4.62 ERA over 25 1/3 IP.

His path to being a closer was delayed as the Astros bolstered their bullpen after the ’95 season by signing free agent closer John Wetteland, likely due to uncertainty around Wagner’s late season injury. Wagner would spend the next two seasons being the primary setup man, leading the team in games pitched and holds both years.

Billy’s breakout year came in 1998. In a bold move, manager Terry Collins announced in spring training that he was switching the roles of Wetteland and Wagner. Collins was on the hot seat as the Astros had a disappointing finish to the ’97 season. While Wetteland wasn’t thrilled with the news, he reluctantly accepted his role and proved to be a reliable setup man. Billy made sure his manager’s gamble paid off and went on to lead the NL in saves with 48. His final line of 10-3 with 48 saves, a 2.12 ERA and 93 K’s in 72.1 IP helped him finish third in Cy Young voting. He led the Astros to the top of the Central Division, though they lost in the NLCS to the Padres.

Wagner saved 40 games for the Astros in each of his next two seasons, though issues with control were popping up, walking 46 in 76IP in 1999 and 40 in 63.1IP in 2000. The Astros finished second both years, and Terry Collins was let go for his inability to take the Astros to the next level.

2001 was a year of uncertainty for Wagner. Collins, the man who given Billy his break, was gone. Instead, the Astros hired a rookie manager in Bob Taylor. Wagner was also entering his contract year.

It turned out to be a year of disappointment. The Astros, after finishing first or second since Wagner was on the team, fell to 73-89. Wagner finished with 30 saves and a rather high 4.33 ERA, though his control was returning. He and the Astros failed to come to terms on a long-term deal and Wagner agreed to give it one more year, signing an extension for well below market value. It was a gamble on Wagner’s part fueled by the very strong free agent crop, headlined by Mariano Rivera.

2002 turned out to be his last year with the Astros. He finished 7-2 with 26 saves and a 2.70 ERA and hit the free agent market. On December 11, 2002 he came to terms on a 1-year $2.72 million deal with the Baltimore Orioles to serve as their closer. His gamble hadn’t paid off, as the free agent crop for closers was once again exceptionally strong (in part because Rivera only signed a one year deal and again was the top closer available). He left Houston 2nd all-time in saves but holding the top three spots on the single season saves leaderboard.

He pitched well for the O’s in 2003 saving 36 games with a 3.02 ERA and helped them get to the ALCS, but management didn’t want him back at the price he wanted. Wagner moved on from there, signing his biggest contract to date: a 3-year deal with the Mariners for $11.52 million.

In his three years in Seattle, he saved 31, 36, and 39 games, respectively. On May 22nd, 2006 Wagner entered a game in the 9th against his old team, the Orioles. Up 4-3, he got two quick outs before 2 singles put runners at the corners. He got Toby Hall to meekly ground out to record his 300th career save. After the 2006 season, Wagner decided to hit the free agent market for a chance at one last long-term contract, and left Seattle as their all-time saves leader (106).

The now 35-year old stayed in the AL West, signing with Oakland for 3 years and $8.08 million, even though Oakland had lost over 100 games the past three seasons. Wagner helped stabilize Oakland’s bullpen by racking up 28 saves and the A’s improved by 16 games in 2006 finishing 77-85. Meanwhile Wagner’s old team – the Mariners – made it to the World Series.

In 2007 Wagner fell out of favor with manager Jim Fregosi. The A’s signed Brad Lidge during spring training as bullpen insurance, and Fregosi went straight to him as his closer. The A’s were making a mid-season push for a wildcard spot and went out and traded for Francisco Cordero who took over for Lidge. Suddenly, Wagner found himself third on the closer depth chart and finished with only 3 saves, though he led the team with 22 holds.

Buck Showalter took over the A’s in 2009 and moved Wagner up as the primary setup man to newly acquired closer Mike Gonzalez. Showalter guided the A’s to a World Series championship that year. Unfortunately Wagner was unable to take part in his first chance at World Series glory, as the labrum he partially tore back in 1995 tore again on August 29th. He finished 2009 5-3 with 4 saves and a 3.11 ERA.

Given his shoulder and his age (now 38) Oakland decided not to resign Wagner. The Dodgers were interested, and signed him for 2 years at $8.44 million – the only time Wagner would earn more than $4 million in a season. The Dodgers, coming off a 110-win season, already had Mariano Rivera as their closer, so Wagner once again settled in to be their setup man. Unfortunately the wheels fell off the Dodgers’ bus as their starting staff was ravaged by injuries. The Dodgers became so desperate that they turned to some of their middle relievers to help out. On August 7th, Billy Wagner made the first of 8 career starts in a no-decision against the Nationals going 4.1 innings giving up one run on 6 hits, striking out 4 and walking one. He earned a win in his next start on August 13th against the Braves, going 6 strong giving up one run on only 3 hits. On the 18th against the Rockies he pitched 5.2 shutout innings getting his second (and final) win as a starting pitcher.

Disappointed with the season in which the Dodgers finished last at 70-92 as well as his role on the team, Billy Wagner announced his retirement from baseball on October 31, 2010. He retired fifth all-time in saves with 366 to go along with a 68-63 record in 1041 games. He was an All-Star four times (1998, 1999, 2000, & 2004).
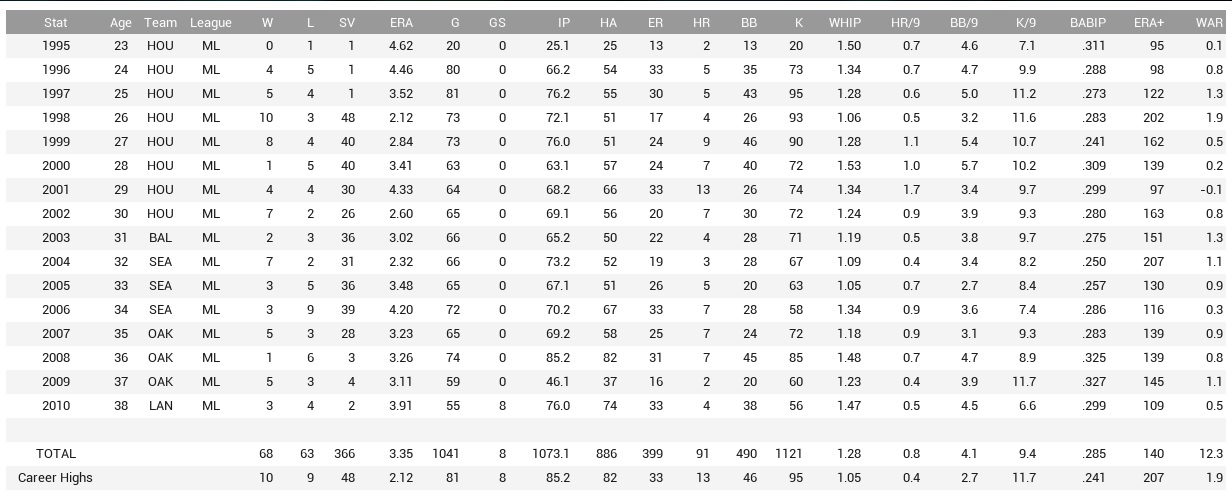
His career pitching stats (click to enlarge):
Wagner

Comparing fake Billy Wagner to the real Billy Wagner, fake Billy had fewer saves (422 to 366) and fewer All-Star seasons (7 to 4) but more wins (68 to 47) and more games (1041 to 853) – and of course more games started (8 to 0). Both Billy’s never appeared in a World Series game, though the fake Billy was on the DL when his A’s won in 2009. One other important aspect in which the real Billy fared better was in lifetime earnings, as fake Billy’s agent was never able to parlay his 1998 breakout season into a big payday.

How well do wOBA and RC Predict Team Performance?

Okay, so we’ve already done two posts looking at OOTP leagues filled with clones of two players: Slappy Slapstick and Sluggish Slugger. One showed that Sluggish, the low BA guy with sexy power, got walloped head to head by Slappy, the unsexy high BA no power guy. The second showed the same in an MLB environment, but only when Slappy and Sluggish both had OPS high above the league average. Sluggish was better in the MLB environment when both had league average OPS.

These sims showed the limitations of OPS – the first big sabermetric stat to make its way into national telecasts – certainly lacks somewhat in being a robust stat to value all players. Being an arbitrary stat simply combining OBP with SLG it’s not surprising that it lacks robustness. So we went looking for something that might work better.

So we turned to wOBA (weighted On-Base Average). This stat, created by Tom Tango, is based on the common sense premise that all hits are not created equal. The stat uses aggregate league totals to weight the value of each method of getting on base (a good description of wOBA and how it is calculated can be found at FanGraphs).

Unfortunately, OOTP does not deal with wOBA, so transferring this to the Slappy/Sluggish universe took a little bit of work. First, we ran one season with Slappy and Sluggish and calculated the weights for wOBA using league totals, and modified the abilities of Slappy and Sluggish to make them equivalent in wOBA and equal to the wOBA from the previous season. This, by the way, gave a rather sizable advantage in OPS to the Sluggers (.887 to .799). Their attributes stats predicted a line for the Slappy’s of .347/.452/.799 with no HR. The Sluggers were designed to go .253/.303/.887 with 42 HR.

Then we set them loose on 5 seasons – after each season we restored the league back so as not to mess with the weights for wOBA which change from year to year.

In this universe, the results were much closer. Teams made up of Slappy’s won an average of 85 games a year with teams made up of Sluggish Slugger’s won an average of 77. While this still might seem an advantage for the Slappy’s, you have to keep in mind we took two very extreme players – the Slappy’s were give the lowest possible rating (1) for gap and power attributes. Teams made up of Slappy’s never hit more than 2 home runs in any single season (and while I didn’t bother to comb through the individual box scores I would not be surprised if they were all inside-the-park jobs). Also, to create a league made solely of these players (along with clones of the same average pitcher), would greatly amplify any differences between the two groups. In a MLB environment where there is a variation in terms of players’ skills, these differences would likely be noticeable at all.

Then we did the same with RC (Runs Created), created by Bill James. This is in thanks to a suggestion made by a member of the Baseball Sim Addicts!!! Facebook group. As with wOBA this took a little bit of tweaking but both Slappy and Sluggish were made to have an equivalent RC of 99. Slappy’s stat line was created to be .371/.491/.862 with Sluggish’s working out to .220/.332/.868. After running 5 additional seasons we came out with nearly the exact same overall results: Slappy’s teams finished with an average of 84 wins with the Sluggers finishing with an average of 78.

wOBA and RC certainly did a lot better at evening out the two teams. One could argue that a difference of 7 or 8 games in a simulation designed to greatly exaggerate any differences goes a long way in demonstrating the robustness of the two metrics. And even with these small but consistent differences they are the best metrics available when applied to a typical ML team. It does lead me to wonder though what is behind the small (and in the real world likely meaningless) advantage the Slappy’s have. Do the formulas need some minor tweaking? Is there something in the OOTP game engine?

Update: After a night of thinking about it, it likely has to do with fielding. All players were set to equivalent fielding ratings – but they were all average. Since the Slappy’s had a greater number of balls put in play, it allowed for more opportunities for errors. Looking back at the yearly stats the Sluggers did consistently produce more errors, some of which would have led to runs. While I cannot say for certain at this time, it would look like that could very well be the deciding factor between the two teams.

“Wherever I Wind Up” Book Review

Baseball and writing.  It’s been said baseball is the most written about sport.  Baseball has a long, rich history.  Do yourself a favor.  Find a book about America’s pastime and learn more about the sport you love!

The New York Mets colors are orange and blue.  Do you know why?  When New York City lost the Giants and the Dodgers to the West Coast, MLB awarded NYC a new team.  The Mets put Brooklyn Dodger blue and New York Giant orange into their uniform to honor the past.  Sure, you can Google these facts, but it’s quite satisfying to discover a fact by delving into a book.

In a semi-occasional series, I will be reviewing my favorite baseball books on the Bullpen By Committee blog site.  Here is one book about a former New York Met that is enjoyable and heck, I even learned something new.

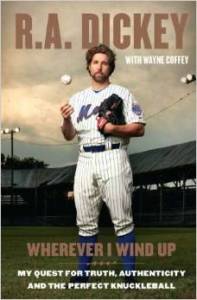
Wherever I Wind Up

Title/Author:  Wherever I Wind Up: My Quest for Truth, Authenticity and the Perfect Knuckleball, R.A. Dickey with Wayne Coffey

Rating:  3 ½ out of 4 Bases (Solid Triple – Very Good)

Review:

R.A. Dickey is a geek athlete.  His book “Wherever I Wind Up” with Wayne Coffey is proof of that.  I use the term “geek athlete” as a compliment of the highest order.  I believe that some athletes that write books have a bit of nerdiness to them and Dickey is decidedly one.  How many professional ballplayers have a B.A. in English Lit and know who William Faulkner is?  In the book, the writers present Dickey as a smart, thoughtful person who also happens to be a ballplayer.  In the foreword of the book, Dickey writes that he has a fantastic memory and it is in evidence several times in this tome.

Dickey was a former first round can’t-miss prospect for the Texas Rangers back in 1996 who was offered a $810,000 signing bonus.  During his initial physical, team doctors found that Dickey had no ulnar collateral ligament in his right arm.  The Rangers could not deal with his new-found freakiness, so his signing bonus was immediately withdrawn.  After a long battle back to the big leagues, Dickey promptly served up 6 HRs in 3 innings in his first game back and set a major league record in the process.  Subsequently, Dickey burned out in his first shot at the majors.  Thus, began Dickey’s geek athlete journey.

During one minor league stop on his Odysseian tour, Dickey tests positive for an opiate. It turns out that he ate a poppy-seed chicken casserole made the night before by his chaplain’s wife. It’s kind of dorky, right?  A few years later, he attempts to swim across the Missouri River while his teammates watch, but chickens out mid-swim and has to swim back.  The geek factor is definitely high here!  He also talks about biking to the ballpark and liking Star Wars.  Welcome to the Geek Athlete Club Mr. Dickey, would you like to be our president?

R.A eventually pulls his geekiest move yet in an attempt to save his baseball career – he learns how to throw a knuckleball.  For those of you who might not know, the knuckleball is the most difficult and nerdiest pitch to throw.  It’s a hard pitch to throw and not easy to hit or catch either.  Dickey eventually masters the pitch, makes it to the big leagues and stays there!  He ends up becoming one of the top NL pitchers in 2012.

This was an excellent book!  After all, it was written by a geek athlete.  As a similarly frustrated athlete in my younger years, I very much identified with struggling with a sport.  I would recommend the book to any baseball fan, geek and non-geek alike.

Style:  Book has a good flow and writing often reads like listening to a conversation.

Stats:  Since we are sabermetrically-minded here at Bullpen By Committee, I have provided a link to RA Dickey’s career stat line:

http://www.baseball-reference.com/players/d/dicker.01-pitch.shtml

URLs to find Book:

Amazon

Barnes and Noble


Slappy’s vs. Sluggers Part 2

My “real” job for the past 20 years has been a researcher. It’s a well-known saying that good research raises more questions than it answers. My previous blog post on singles hitters versus sluggers raised a few questions and comments. One comment came from through Twitter from Geoff M.:

Another well-known fact of research is that a single study will always have inherent limitations (or flaws, if you like). Using just a league of Slappy’s and Sluggers has the shortcoming of potentially amplifying any differences between the two. Just because it shows up in a league made completely out of those types of players doesn’t mean it would have any kind of noticeable impact in a league more representative of MLB.

So I went ahead with Geoff’s suggestion.

The original Slappy vs. Slugger sim gave each player an arbitrary OPS of .800. For my initial sim, I gave each player the league average after a 2014 MLB sim, which came out to .732. Turning off injuries, player development, and not allowing the AI to make any roster changes, I simmed 10 singular seasons with 1 team of Slappy’s, 1 team of Slugger’s, and 28 MLB teams. Both the Slappy and Slugger teams had Average Pitchers who were created with expected stats to be the league average.

The first set of 10 seasons was a bit eye-opening:

Picture2

In only 2 seasons did the Slapsticks win more games than the Sluggers, and as you can see, both teams made up of league average players were just utterly awful, losing on average more than 100 games a season.

This brought up the question of whether the OPS value used affected the outcome. So I did two additional sims: one replicated the original 4-team Slappy/Slugger league with everyone having a .732 OPS and the other replicated the Slappy/Slugger in MLB with each Slappy and Slugger having an .800 OPS.

First, the original 4-team league. Turns out changing the OPS to .732 made no difference, with season after season having the two teams of Slappy’s well ahead of the Sluggers (I also ran several more seasons of the original experiment just to be sure). The Slappy’s consistently won 90+ games with the Sluggers winning 60+. So the second level of OPS made no difference in that sim.

The MLB sim with both Slappy’s and Sluggers having .800 OPS was different. Here is the average performance of each team over ten seasons comparing both sets of sims:

Picture3

In this, the Slappy’s greatly improved their win total and beat out the Sluggers in every category (though OPS was very close). The Slappy’s even had two winning seasons. I wish I had a compelling answer for why the Sluggers outplayed the Slapsticks when each had a low OPS in an MLB environment but the Slapsticks won out in an MLB environment with a higher OPS while the sims with just the 4-team league always showed a consistent Slappy advantage.

At least with the four different sims we ran, the Slappy’s outperformed the Sluggers in three of them, though in a real-life environment it may depend on the value of OPS and not be a very straightforward answer.

If you have any hypotheses feel free to comment below or send us a tweet at @BullpenByComm.

Singles Hitters vs. Sluggers

One of the classic baseball debates is the relative worth of Punch and Judy hitters and power hackers. Which one provides greater value to their team?

Using Out of the Park Baseball, we decided to put this to the test. Using their player editor feature, I created the following three players:

Slappy Slapstick
Projected stats
BA: .347; OBP: .452; SLG: .347; OPS: .799

Sluggish Slugger
Projected stats
BA: .216; OBP: .253; SLG: .547 (42HR over 660PA); OPS: .800

Average Pitcher
Projected stats
OAVG: .248; ERA: 3.75

Slappy had high ratings for BABIP, Avoid K’s, and Eye/Patience with the lowest possible scores for Gap and Power. Sluggish had high Gap and Power scores with low scores for other ratings. All other ratings (e.g. basestealing, fielding) were equal. The overriding factor for the main ratings was to get projected OPS to be equal, which I did as best as possible.

I cloned each player to fill up 2 teams of Slappy Slapsticks and 2 teams of Sluggish Sluggers. Each team had an 11-man pitching staff made up of Average Pitchers.

Then I set them loose on a 162-game season. Here is a snapshot of the final standings, with the results plainly clear.
Standings

The two teams of Slappy Slapsticks far and away beat on the Sluggers. The final stats showed that OPS ended up actually somewhat in favor of the Sluggers. Sluggers made up the entire top 5 and 8 of the top 10 league leaders in OPS.
OPS
(Click chart to enlarge)

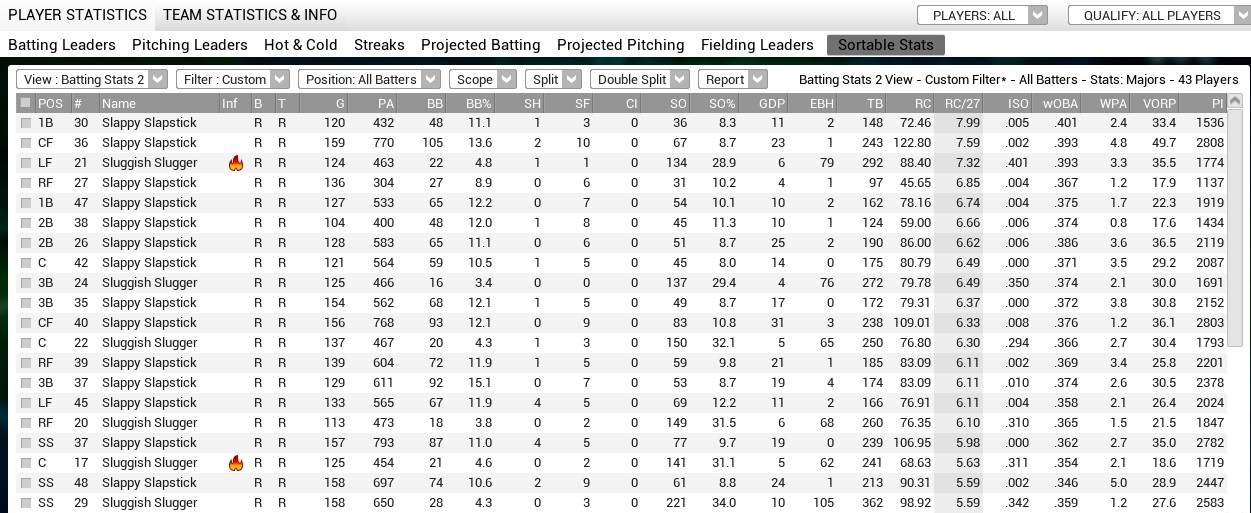
RC27 (Runs Created per 27 outs) was in favor of the Slapsticks, with 7 of the top 8 leaders in that category.
RC Leaders
(Click chart to enlarge)

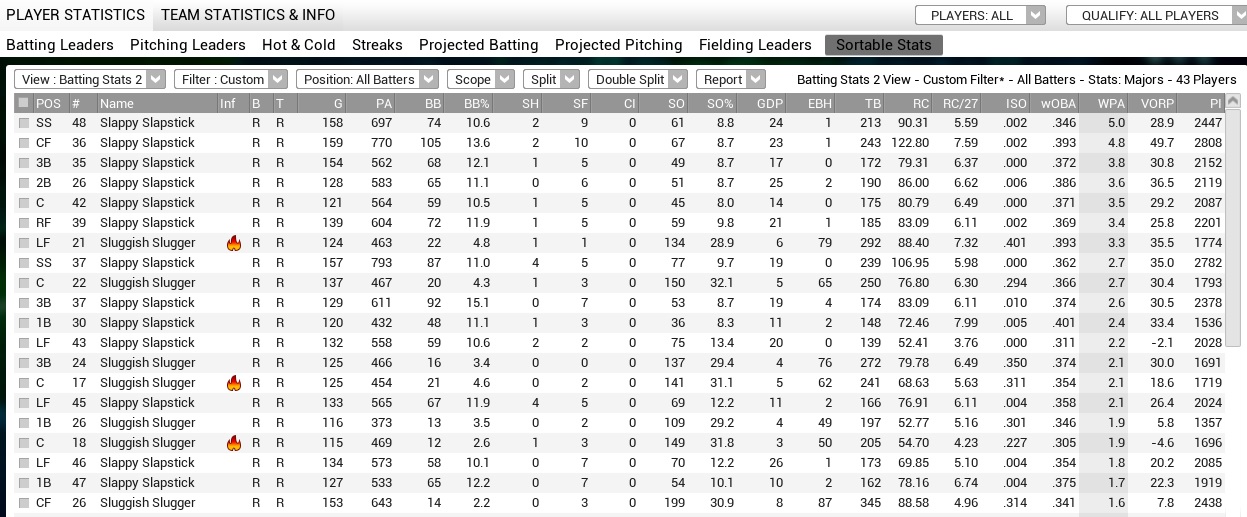
WPA (Win Probability Added) was also in favor of the Slapsticks taking the top 6 spots in that category.
WPA Leaders
(Click chart to enlarge)

It’s not possible from this exact run to know what sabermetric stat put the Slapsticks over the top as some (such as BABIP) were designed to be greater for the Slapsticks than the Sluggers. This simulation shows that OPS being equal, a singles hitter is more valuable in the end than a slugger, but it also shows that OPS, being a somewhat arbitrarily derived statistic, is not the defining stat to determine the value of a hitter or how that hitter might translate to team performance.

An Alternative Baseball Universe

I’ve been hooked on Out of the Park Baseball since OOTP 3 (since OOTP16 will be coming out this year it’ll be about 13 years) and have found that its breadth and realism only improves with each version. I won’t go through all of its capabilities here, but it’s absolutely worth the purchase if you’re into baseball simulations.

One of my projects with OOTP was to rerun all of MLB history using OOTP. Baseball more than any other sport clings to its history so it was interesting to see what an equally plausible history might have been like.

I just started it in 1871 and let it sim by itself all the way to the end of 2014 only checking periodically to adjust who made the Hall of Fame. The only change I made was that players were drafted instead of playing for the teams they really played for.

This alternative history looks quite different.

One example is Cy Young. It turns out in our alternate universe Cy wrecked his shoulder in 1900 and ended up with a respectable but unmemorable 193 career wins. The Cy Young award became the Charlie J Ferguson award. Ferguson, who in real life only pitched 4 pretty good seasons before succumbing to typhoid fever prior to the 1888 season (99-64 career record going 30-9 in 1886) pitched in this alternate universe from 1884 to 1906 compiling a 475-375 record and a whopping 218 career WAR.

Babe Ruth was a good enough pitcher and bad enough fielder that he stayed with pitching, finishing with 233 career wins. He failed to make the Hall of Fame.

Hank Aaron (326 HR), Willie Mays (336 HR), Willie McCovey (253 HR) all fell short as they succumbed to injuries prematurely. Same with Bob Gibson (85 career W). None are a real part of that universe’s baseball lore.

However, Tony Conigliaro never got beaned in the face, and for a time was the HR king (passing Mickey Mantle), and after 2014 was still second all-time with 681 HR. Mark McGwire’s body didn’t break down and he’s the home run leader at 687. Sosa and Bonds had subpar careers due to injury. Mantle and Ted Williams each won the MVP award 10 times while Denny McClain never got into trouble with the mob and finished with 7 Charlie Ferguson awards, the most ever.

Sandy Koufax did a John Smoltz and for a while was the career saves leader with 351, but was surpassed by Masanori Murakami. In the real world, Murakami was the first Japanese player in the majors but played only 2 seasons for the Giants before he contractually had to return to Japan. Here he stayed in the majors and finished with 502 career saves. He was later surpassed by Rob Dibble (528) and Robb Nen (629).

The best single season in this alternative universe belonged to Lou Gehrig (1930) – .451BA, 45HR, 126RBI, 14.1WAR and that’s with missing 7 weeks due to *gasp* injury. Those seven weeks actually limited him to only 490 plate appearances, below the threshold to qualify for top season batting average.

Johnny Damon was lucky enough to play for Colorado and was the last player to hit .400, going .406 in 1999 with 37HR and 150RBI to boot (10.1 WAR).

The best hitter of all-time would be an argument between Rogers Hornsby and Ted Williams, depending upon whether you favored WAR or OPS as your defining statistic. Given changes in the game across the years, WAR would likely be the best metric to determine an all-time best hitter. Hornsby played from 1915 to 1940. He’s the all-time hit leader with 4378. He smacked 446 HR, had 2229 RBI and is 1st all-time in career VORP (1510) and WAR (150). Williams played from 1939 to 1958 hitting 569 HR with 1740 RBI, a .337 BA. He was first all-time in career OPS (1.071).

The all-time leaders in WAR are:

– Rogers Hornsby (150)
– Luis Gonzalez (142?!?!?)
– Ted Williams (134)
– Mickey Mantle (134)
– Albert Pujols (132 – still active)

The longest hitting streak was 46 games by the legendary Possum Whitted who in our alternate universe played from 1912-1924 with a career .284 average and 7.2 WAR. In real life he played mostly as a part-timer from 1912-1922, with a career .269 BA. Mo Vaughn had the 3rd longest hitting streak at 44 games.

Your all-time great franchise is the Athletics (PHI-KC-OAK) with 38 playoff appearances and 13 World Series titles (both tops). The Yanks haven’t won the World Series since 1941 while the 1950’s belonged to Detroit who appeared in 5 of 6 WS from 1950-55 and won 4 of them, then winning again in ’58. The AL won 14 of 15 WS from 1958-1972. The Brewers franchise (starting with the Seattle Pilots in ’69) is your model of futility appearing in the playoffs only once and having a .421 lifetime winning percentage.

While all this is interesting to think about it also brings up a question about OOTP and the accuracy of its simulations. All the major milestone records I’ve noted thus far are all below real-life records. Is this a limitation of all types of sims? Career records for HR, BA, RBI, W, S, are all higher in real-life than in this alternate universe, but both Hornsby and Ty Cobb had more hits than Pete Rose (4378 and 4377 respectively – Rose only finished with 2514). The record for career triples was blown away (Sam Crawford beat himself out on that one 384 to 309). Jim Handiboe demolished the real-world record for career losses. Jim had a 443-484 record in our alternate universe playing for bad Brooklyn teams from 1886-1911 compared to Cy Young’s 316 real-world losses. There were a few single season outliers such as Gehrig’s .451 season and Richie Sexson knocking in 190 runs in 2000 in this alternate universe, but it’s too small a sample size with too many other factors to jump to any conclusions.

We are undertaking additional projects using OOTP which we will post, as we try to answer various what-if scenarios and age-old baseball questions using sims. We’re happy to take suggestions that we could address using OOTP. Feel free to leave those in the comments section.